Stick the Landing
Stay on Target
I’ve recently spent a decent amount of time (in between move-prep and traveling) noodling on a new project that has lived in my head for a while: a moon lander visualization.
The new lunar lander page shows simple landing physics (basic gravity + thrust), along with some pre-planned burns over real lunar terrain data. This started off as a straightforward animation of a descent trajectory over a sphere where you use the arrow-keys and spacebar to thrust the lander in different directions on a descent trajectory, and ended up as an auto-burn-guidance planner with optional manual burn planning for a soft landing on a south pole crater built from 5-meter Lunar Reconaissance Orbiter (LRO) data. Classic.
This post might get a bit unwieldy, so here’s an overview: Map data first (DEM source, and mini-visual of the region we’re landing in), then lander guidance, which includes toy model, sim dynamics, auto burn-planning, and the simple search/optimization algorithm used in auto burn-planning.
Map Data
A really easy way to show terrain in a 3D plot or interactive visual is by using a Digital Elevation Map (DEM). At a super fundamental level, this is just a grid of values representing height/elevation of terrain per-pixel parameterized in some form of X/Y coordinate. For terrain, this could literally just be a lat-lon grid where the value in each grid cell is a height in meters. Thus, the size of the cells (i.e. size of lat/lon grid point spacing) determines the resolution of the map, since one pixel is used to plot each point.
For this visual, I tried using some pretty coarse data initially, like 100meter/pixel elevation maps. This obviously is not satisfying for actual landings, because we’re going to use a lander model that is smaller than 100meters in footprint. I started looking for the highest resolution data I could find, and eventually found some 5meter/pixel elevation data from the Laser Altimeter instrument aboard LRO (full source data here, described in Barker et al., Planetary & Space Science 203 (2021) 105119). The tiff image on that page contains DEM data for a +/-100km box surrounding the lunar south pole, with the pole itself at the center pixel.
I had claude-code read the tiff file into array data and plot it using threejs into an interactive viewer:
You can drag to orbit and scroll to zoom. Since we are looking at a pretty small slice of the surface, relative to the diameter of the moon, the terrain here is visualized as a curved mesh centered at the south pole. Its useful to mess around with this to get a rough sense of what real lunar terrain is like. This DEM gets shrunk a bit (down to a 36km window of detailed DEM data), and is used by the lander simulation we’re discussing next.
Lander Guidance
Lander Model
The lander model is a claude-code-generated glb file, intended to look like an arbitrary rocket with some legs. Properties are summarized in the table below.
| kg | ||
| kg | ||
| kN | ||
| s |
Touchdown is triggered in the simulation by a circle encapsulating the landing legs intersecting the terrain. We sample 5 points on this circle and do a simple point intersection check to verify touchdown.
Dynamics
The simulation dynamics are pretty simple: spherical gravity and thrust act on the lander. The reference frame we’re using is moon-centered and inertial. There is no rotational attitude dynamics here, desired attitude is achieved instantaneously (but subject to kinematic rate-limiting) based on burn direction or user input. We paramaterize attitude in a local-vertical local-horizontal frame, derived from the position vector and a fixed nominal descent-plane normal at each timestep:
Pitch is analogous to aircraft pitch, and points the thruster in the orbital descent plane, while yaw points the thruster out of the descent plane. We’re ignoring roll since this does not really matter for the burn placement and simplified simulation here. Roll is most relevant if you want to add attitude constraints like “crew must be able to see the lunar surface” or “roll to hit some specific thermal attitude.”
Throttle represents fraction of max thrust applied, and total mass . The overall equations of motion are
subject to bounded throttle and slew rates, since attitude is a rate-limited kinematic input:
The landing gate looks at position over pad, lateral velocity, and the following off-vertical angle:
| symbol | value | |
|---|---|---|
| m³/s² | ||
| m | ||
| rad/s | ||
| rad/s |
The auto-planner
The simulation contains a simple onboard auto-burn-planner to populate a default set of burns that lands the spacecraft at an arbitrary target zone. We’re adopting a two-burn descent approach, parameterised by two constant-attitude, full-throttle arcs separated by a ballistic coast.
The target for burn planning is a handover box at m AGL descending at m/s, where simple closed-loop guidance takes over. Each candidate is scored on how close it gets, with the following cost on “closeness” in position and velocity to the handover target:
Running out of propellant and flying into the terrain are modeled as penalties. The ground penalty is set up to guide the solution towards being altitudes greater than 20m throughout flight, to provide buffer against hitting terrain.
A candidate counts as feasible only if it arrives inside the box on every axis at once:
Searching with Nelder–Mead
There is a lot of really interesting literature on solving the fuel optimal burn planning for descent guidance problem. The most famous papers and solutions in the public domain are generally tied to a direct technique known as ‘lossless convexification’ that is worth reading about. For this basic simulation where we’re making assumptions about number of burns and prescribing the shape of the solution, I’m using a simplex solver called Nelder-Mead.
Nelder-Mead is nice because there is no derivative calculation necessary, so we don’t need to worry about differentiability in our setup above. Every trajectory candidate is scored by running the simulation with a few hundred seconds of RK4 through a terrain lookup. The algorithm keeps eight guesses, representing vertices on the simplex. On each iteration, it finds the worst point/vertex, and steps it away from the rest: further away if that helped, back toward the “middle” of the 8 points if it didn’t, and if nothing helps, it pulls everything in around the best point so far. There is no promise the answer is globally optimal here, which is fine for this level of simple sim. Mathematically, each iterations possible actions look like this:
with the standard coefficients , , , , stopping once the simplex has collapsed to or after 220 iterations.
Among the candidates that survive the iterations, the winner is the one with most propelleant left:
Fly it
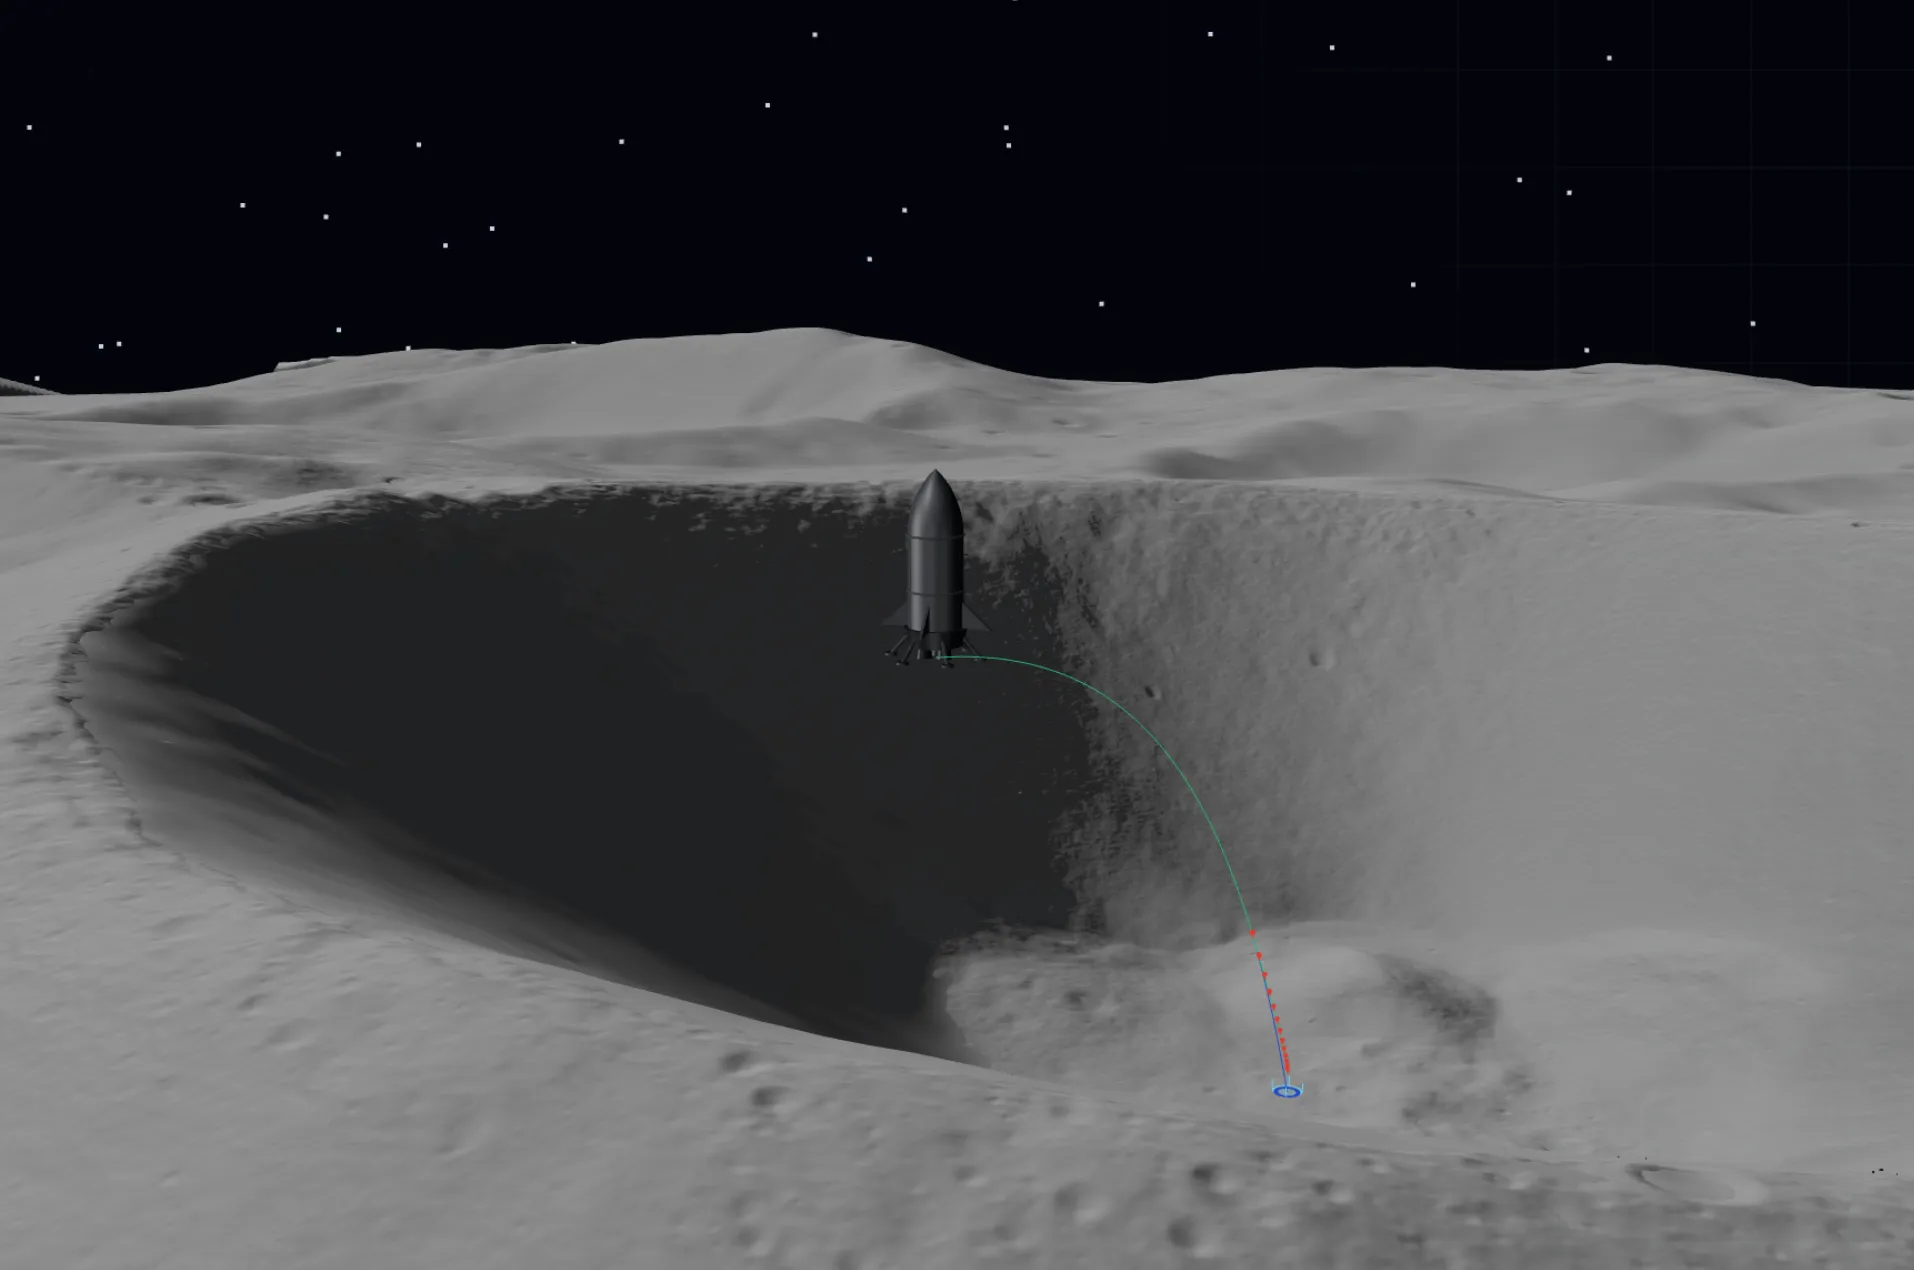
The simulator is at /lunar-lander/. Try messing around with manaul burns, and also try flying in keyboard-controlled “manual” mode, and see if you can hit the landing. There are two propagated trajectory lines leaving the lander: a blue line indicating where the lander is going if all thrusts stop instantaneously and the lander just propagates ballistically, and a green line indicating the lander’s trajectory on the current guidance/burn plan (with red arrows showing the direction of burns along the plan!). Its fun to mess around with the directions of potential burns, and see how that impacts the propagated lander trajectory. This is a neat way (in my opinion) to build some intuition on what burn directions and durations do to the actual physics of a descending vehicle in space.
All of the implementations here were done by claude, which was pretty neat to see. I provided guidance on what to solve and what the actual form of the dynamics and kinematics should be, and I reviewed the physics output from claude. This was a visual project I’ve wanted to do for a long time, so it was really cool to move quickly on it without getting caught up in web dev/visual details, and just focus on the physics, basic guidance, and map data. I’d like to add more advanced guidance planning to this at some point. In the meantime, don’t miss!